The analytics feature in Nureva® Console is available with Nureva Pro. With this feature, users can explore data relating to the Nureva audio devices in their organization.
Don’t have Nureva Pro?
Users on standard plans can still view Nureva Console analytics data from the past 3 days.
Learn more about Nureva Pro.
Why use Nureva Console analytics?
Analytics provide an understanding of how Nureva audio devices are being used, helping to ensure optimal audio experiences. With this feature, users can explore device usage, background noise, sound location and signal-to-noise ratio data.
Exploring device usage data can give insights into:
Whether devices are being used consistently by meeting participants.
Whether conferencing spaces are being used efficiently.
Which conferencing-enabled spaces are most or least popular.
Exploring data on background noise levels can help a user to:
Compare background noise levels across multiple rooms.
Troubleshoot when audio issues are reported.
Proactively detect and correct issues.
Identify where to invest in improving room acoustics.
Exploring sound location data (HDL410 systems only) can give insights into:
How meeting rooms are being used.
Whether meeting rooms are being used effectively, from a space perspective.
Exploring signal-to-noise ratio levels (HDL310 and HDL410 systems only) can help a user to:
Compare signal-to-noise ratios across multiple rooms.
Troubleshoot when audio issues are reported.
Proactively detect and correct issues.
Identify where to invest in improving room acoustics.
Required before starting:
For HDL200, HDL300 and Dual HDL300 devices, ensure the Nureva Console client application in each room is running and up to date. This application must remain running to collect data. The latest version is required.
For HDL310 and HDL410 devices, ensure the device is connected to a network using the network port.
Confirm the Nureva audio devices have the latest firmware.
Update the HDL200 system firmware
Enroll the Nureva audio devices in Nureva Console cloud to enable remote management.
How to use the analytics feature in Nureva Console
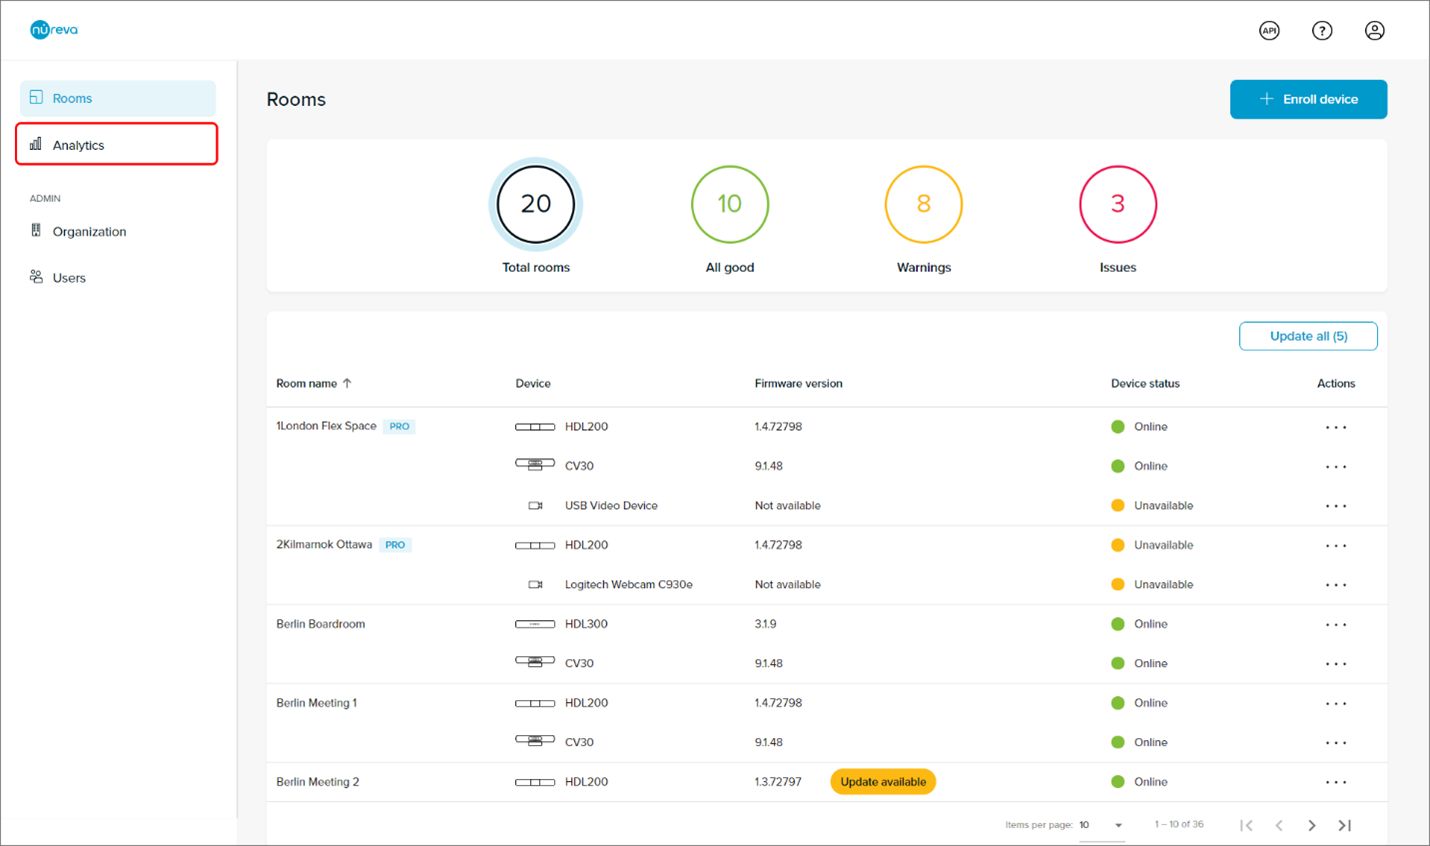
Access the analytics feature by logging in to Nureva Console cloud and going to Analytics in the navigation menu on the left.
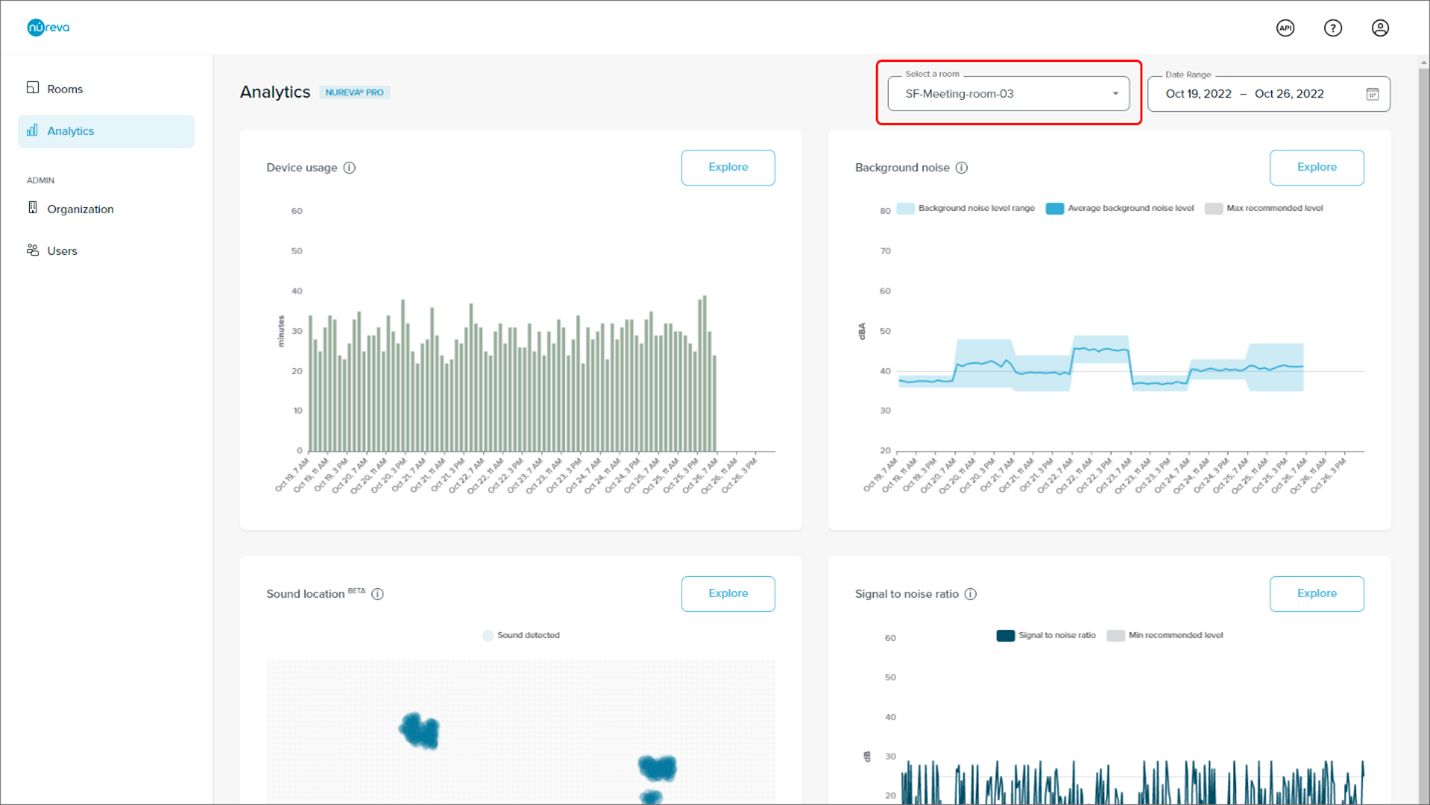
On the Analytics landing page are the Device usage, Background noise, Sound location and Signal-to-noise ratio charts.
The charts show data for the first room in the organization.
Rooms are listed alphabetically.
Data for different rooms can be viewed and compared by using the Select a room drop-down menu.
With a Nureva Pro plan:
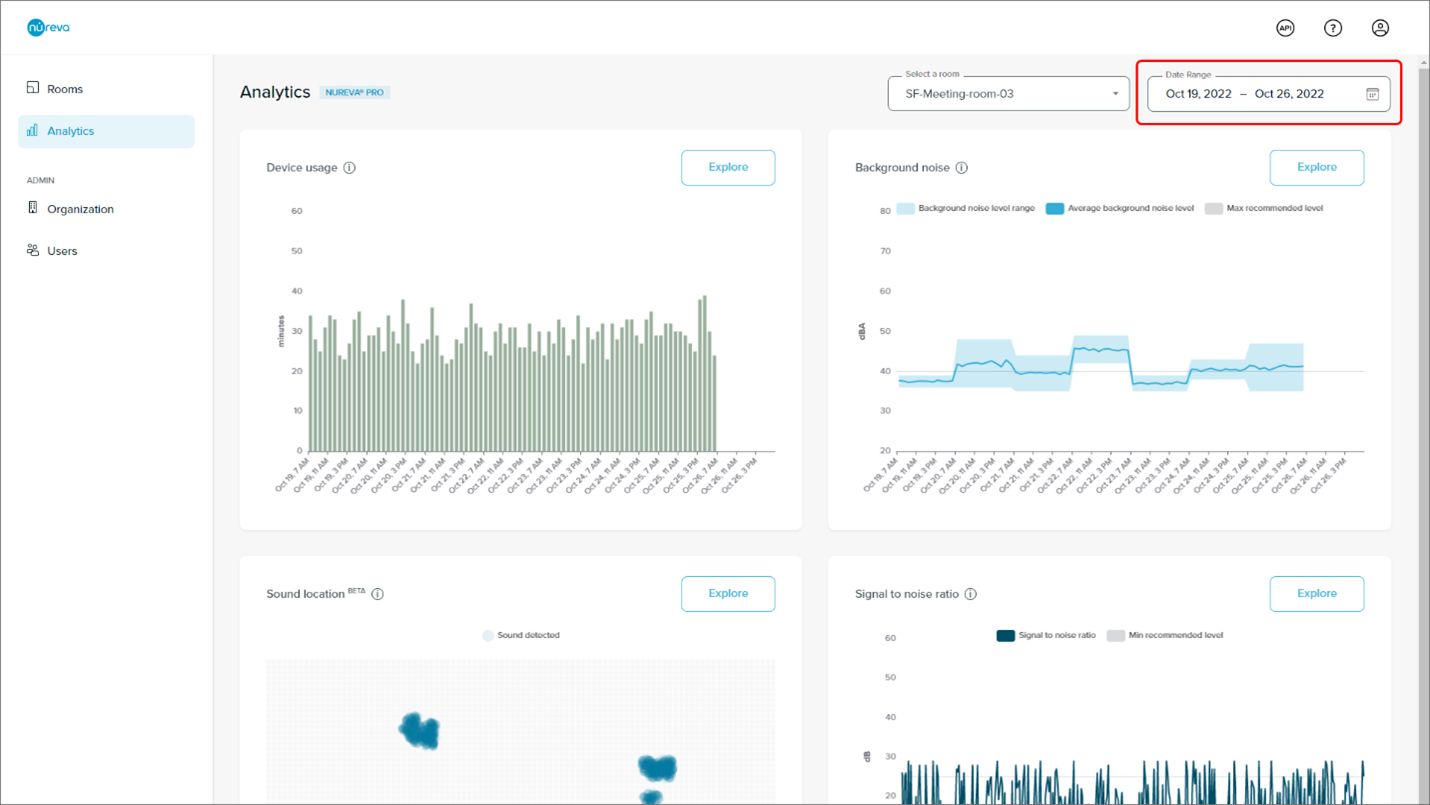
By default, these charts display data from the past week. Change the date range by using the Date range selector in the top-right corner of the browser window.
Select a single day or a date range of up to 31 days. This date range selection and the room selection will persist when exploring the charts.
From the landing page, click the Explore button to select the type of data to be accessed.
With a standard plan:
Try out this Nureva Pro feature by viewing data from the past 3 days.
It is not possible to change the date range.
Learn more about how to explore and interpret each data type:
Navigation
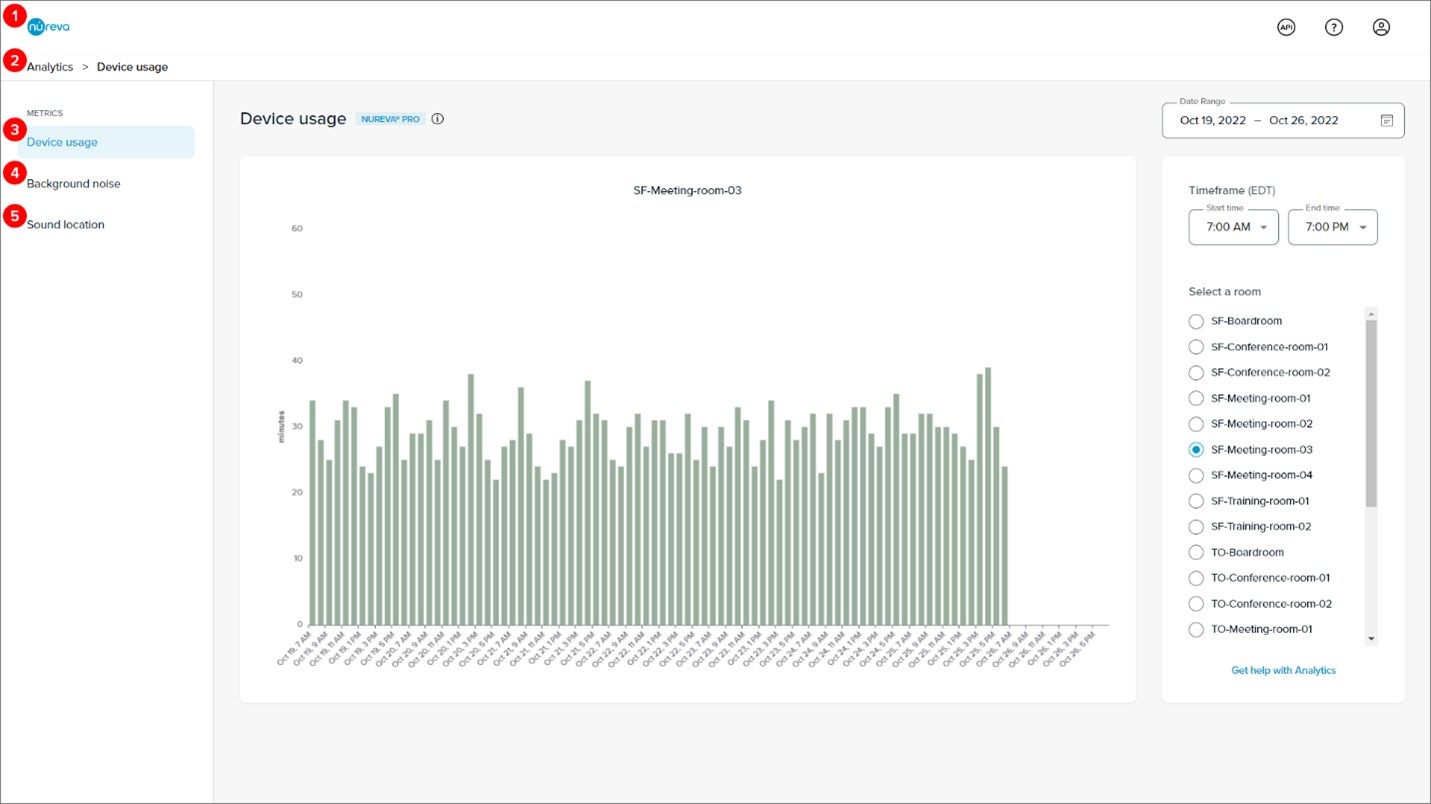
Click the Nureva logo to enter the Rooms dashboard to manage Nureva devices.
Click Analytics in the breadcrumb to return to the Analytics landing page.
Click Device usage in the menu on the left to view device usage data.
Click Background noise in the menu on the left to view background noise data.
Click Sound location in the menu on the left to view sound location data.
Click Signal-to-noise ratio in the menu on the left to view signal-to-noise ratio data.
How far back in time can I go?
With a Nureva Pro plan:
Device usage, background noise and signal-to-noise ratio data is available as far back as 1 year.
There is a hard limit of September 1, 2021 (when Nureva first enabled data collection).
Sound location data is available for the past 6 months.
The date range is limited to a maximum of 31 days at a time.
With a standard plan:
Data is available from the past 3 days.
Missing data
The analytics in Nureva Console can only display data if it’s been collected. Selecting a date range for which data wasn’t stored will generate a message that says: Hmm ... looks like your audio device was not collecting data at that time. Please select different dates or times.
There are a few reasons why data wasn’t stored for a particular date range, as follows.
Device firmware was not sufficient
Nureva audio devices start collecting data only after the firmware is updated:
HDL300 and Dual HDL300 — firmware version 2.5.72+
HDL200 — firmware version 1.4.72798+
HDL310 and HDL410 — firmware version 1.1.209937+
Device was not online
Nureva audio devices collect data when they’re in the online state in Nureva Console cloud. There may be times when there’s a data gap in a chart due to the device not being online.
HDL310 or HDL410 cable was unplugged
Sound location data is only available for rooms with HDL410 devices. This data can only be collected when both microphone and speaker bars are connected to the connect module. If one or both microphone and speaker bars are disconnected, there will be a gap in the data shown in the sound location chart.
Signal-to-noise ratio data is only available for rooms with HDL310 or HDL410 devices. Signal-to-noise ratio data can only be collected when at least one microphone and speaker bar is connected to the connect module. If the microphone and speaker bars are disconnected from the connect module, there will be a gap in the data shown in the signal-to-noise ratio chart.
Cannot view sound location data
Sound location data is only available for rooms with HDL410 devices. To view this data, the HDL410 device must be fully connected. If one or both microphone and speaker bars are disconnected from the connect module, the sound location data chart will not show. Instead, a message will say: Sound location data is only available for rooms with HDL410 devices.