Why explore background noise data?
Data from Nureva® audio devices about background noise levels can provide valuable insights. The data can be helpful in:
Comparing background noise levels across multiple rooms.
Troubleshooting when audio issues are reported.
Proactively detecting and correcting issues.
Identifying where to invest in improving room acoustics.
What background noise data is available?
The background noise chart shows the average, minimum and maximum background noise levels over time for the selected room, measured in dBA. It also shows the maximum background noise level recommended by Nureva for comparison.
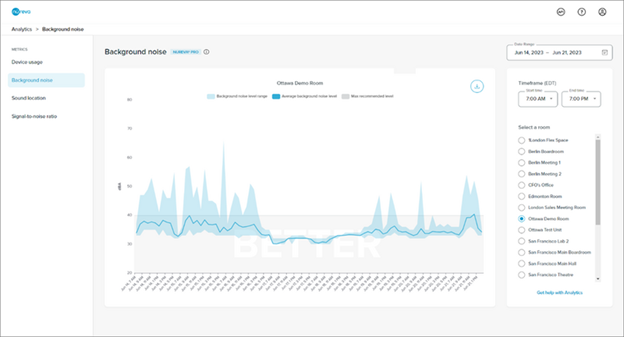
Investigating background noise levels can help with troubleshooting audio issues. When background noise levels in a particular room are higher than those recommended, comparing noise levels at different time intervals can help to determine the source of the noise.
Nureva advises a maximum background noise level of around 40 dBA. If the analytics data is reporting beyond 45 dBA for a sustained period, we recommend reviewing the space to determine what can be done to decrease background noise levels.
In the Background noise chart, the area below the recommended 40 dBA line is shaded gray with the word BETTER displayed in white letters. This contrasts with the Signal-to-noise ratio chart, where values above the line indicated are recommended.
Explore background noise levels in the room on different days and at different times to determine if there is a pattern to when peak noise levels occur. This could help in determining the best times to visit the room to investigate the source of the noise.
Learn more about background noise.
How to explore background noise data
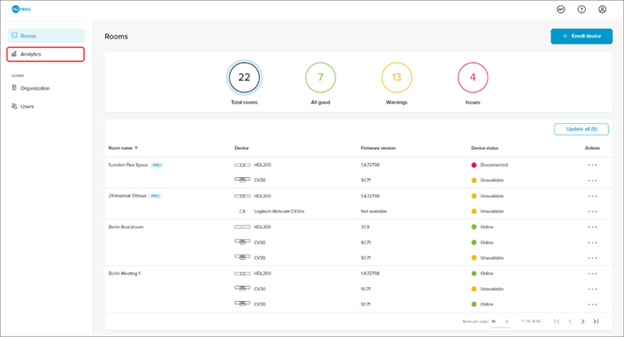
Access the Analytics feature by logging in to Nureva Console cloud and proceeding to Analytics in the navigation menu on the left.
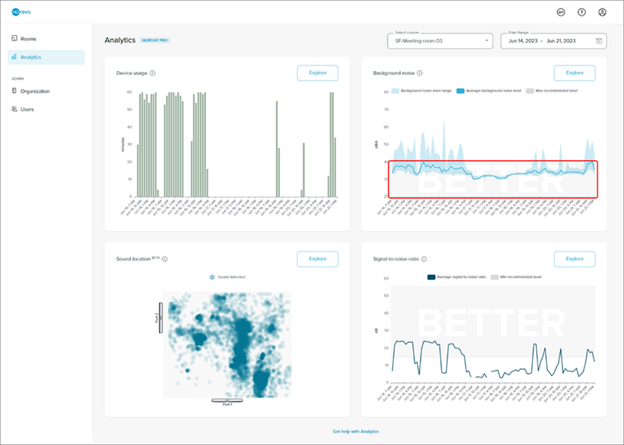
On the Analytics landing page are the Device usage, Background noise, Sound location and Signal-to-noise ratio charts.
The charts show data for the first room in the organization alphabetically.
View and compare data for different rooms using the Select a room drop-down menu.
With a Nureva Pro plan:
By default, these charts display data from the past week.
Change the time period in the Date range selector in the upper-right side of the browser window.
Select a single day or a date range of up to 31 days.
Custom date ranges persist when exploring the chart.
With a standard plan:
Try out this Nureva Pro feature by viewing data from the past 3 days, although note the date range cannot be changed.
From the landing page, click the Explore button on the background noise data chart to open a larger version. This chart shows both the average and the range of background noise measurements over time.
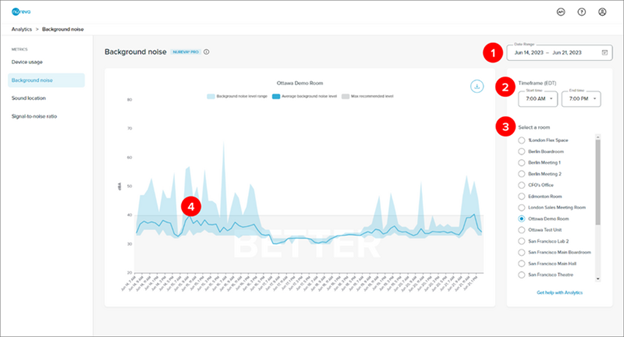
Explore background noise data through the controls explained in more detail below. Any changes made will persist when proceeding to the device usage, sound location and signal-to-noise ratio charts.
1. Date range
With a Nureva Pro plan:
Change the date range by clicking on the calendar icon.
Select a single day or a range of up to 31 days.
The example above shows a date range of June 14 to June 21, 2023.
Custom date ranges persist when exploring the chart.
With a standard plan:
Try out this Nureva Pro feature by viewing data from the past 3 days (the date range cannot be changed).
2. Time frame
This setting filters the data from the selected date range to show certain time periods of each day.
The example above shows a time frame of 7:00 a.m. to 7:00 p.m. Data captured on the selected days between 7:00 a.m. and 7:00 p.m. is displayed.
Change the time frame using the drop-down menus for Start time and End time.
The minimum range is 1 hour.
The time zone will match the computer being used to access analytics. This might not be the same as the time zone where the Nureva audio device is located.
Selecting a longer time frame will result in a broader visualization. Data points that do not contribute to a larger pattern of use are removed to make it easier to spot such patterns. To see more detailed sound location data, try selecting a shorter time frame.
3. Select a room
View and compare data for different rooms by selecting rooms in the list.
4. Chart interactions
Hover over a particular data point and a pop-up window will show the time stamp and the data value for that x-value.
Use a mouse or trackpad to zoom into the chart to view data for a smaller timescale.
The chart legend also functions as a filter.
Clicking or tapping on a legend entry will switch between showing and hiding that type of data in the chart.
The combination of the date range and time frame selections determines the level of detail at which the data is displayed.
See the data in finer detail by selecting a shorter date range and/or time frame.
For a coarser level of detail, select a longer date range and/or time frame.
Exporting background noise data
Background noise data can be exported as a CSV file.
Click the export icon in the upper-right corner of the background noise chart.
The data currently visible in the chart will be downloaded in the browser.
The CSV file will reflect the date range and time filter selected at the time of export.
The export button will be unavailable if there is no data visible in the chart.
Learn more
Learn more about how to explore and interpret other data types:
Get a general overview of analytics features, including troubleshooting:
Get started with Nureva Console analytics
Discover the extra features and protection available with Nureva Pro: