Why explore device usage data?
Data from Nureva® audio devices about their usage can provide valuable insights into:
Whether the devices are being used consistently by meeting participants.
If meeting rooms are being used efficiently.
Which conferencing-enabled spaces are the most or least popular.
What device usage data is available?
The Device usage chart provides data about the time and duration when the microphone of each enrolled Nureva audio device was in use. This includes times when the microphone was muted.
It also shows the total minutes each device was in use over different time intervals. Identifying patterns of use will help in understanding whether rooms and Nureva audio devices are being used effectively.
How to explore device usage data
Access the analytics feature by logging in to Nureva Console cloud and proceeding to Analytics in the menu on the left.
On the analytics landing page are the Device usage, Background noise, Sound location and Signal-to-noise ratio charts.
The charts show data for the first room listed in the organization alphabetically.
View and compare data for different rooms using the Select a room drop-down menu.
With a Nureva Pro plan:
By default, these charts display data from the past week.
Change the time period in the Date Range selector in the upper-right side of the browser window.
Select a single day or a date range of up to 31 days.
Custom date ranges persist when exploring the chart.
With a standard plan:
Try out this Nureva Pro feature by viewing data from the past 3 days, although note the date range cannot be changed.
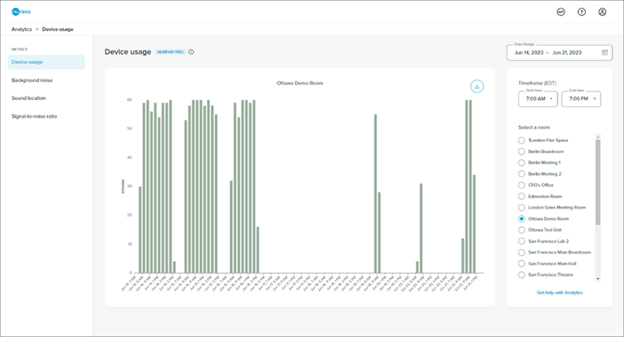
From the landing page, click the Explore button on the device usage data chart to open a larger version.
View a larger version of the device usage chart
Explore device usage data through the controls explained in more detail below. Any changes made will persist when proceeding to the background noise, sound location and signal-to-noise ratio charts.
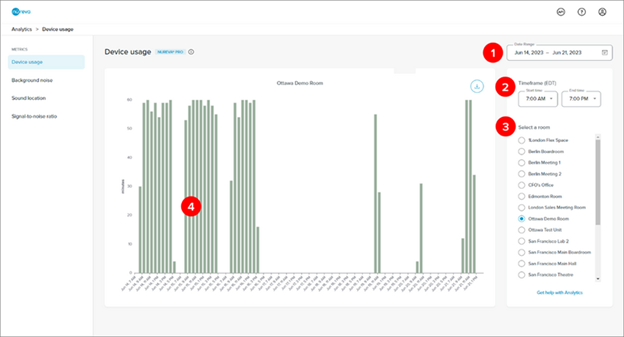
1. Date range
With a Nureva Pro plan:
Change the date range by clicking on the calendar icon.
Select a single day or a range of up to 31 days.
The example above shows a date range of June 14 to June 21, 2023.
With a standard plan:
Try out this Nureva Pro feature by viewing data from the past 3 days (the date range cannot be changed).
2. Time frame
This setting filters the data from the selected date range to show certain time periods of each day.
Change the time frame using the drop-down menus for Start time and End time.
The minimum range is 1 hour.
The time zone will match the computer being used to access the analytics. This might not be the same as the time zone where the Nureva audio device is located.
The example above shows a time frame of 7:00 a.m. to 7:00 p.m. Data captured on the selected days between 7:00 a.m. and 7:00 p.m. is displayed.
3. Select a room
View and compare data for different rooms by selecting rooms in the list.
4. Chart interactions
Hover over a bar on the graph to see a pop-up window with the time stamp and the x-value data.
Use a mouse or trackpad to zoom into the chart to view data for a smaller timescale.
See fine details about the data by selecting a shorter date range and/or time frame.
For a coarser level of detail, select a longer date range and/or time frame.
The combination of the date range and time frame selections determines the level of detail at which the data is displayed.
Exporting device usage data
Device usage data can be exported as a CSV file.
Click the export icon in the upper-right corner of the device usage chart.
The data currently visible in the chart will be downloaded in the browser.
The CSV file will reflect the date range and time filter selected at the time of export.
The export button will be unavailable if there is no data visible in the chart.
Learn more
Learn more about how to explore and interpret other data types:
Get a general overview of analytics features, including troubleshooting:
Get started with Nureva Console analytics
Discover the extra features and protection available with Nureva Pro: