Why explore sound location data?
Data from Nureva® HDL410 devices about sound location data can provide valuable insights. The data can be helpful in determining:
How meeting rooms are being used.
Whether the spaces used for meeting rooms are being used effectively.
What sound location data is available?
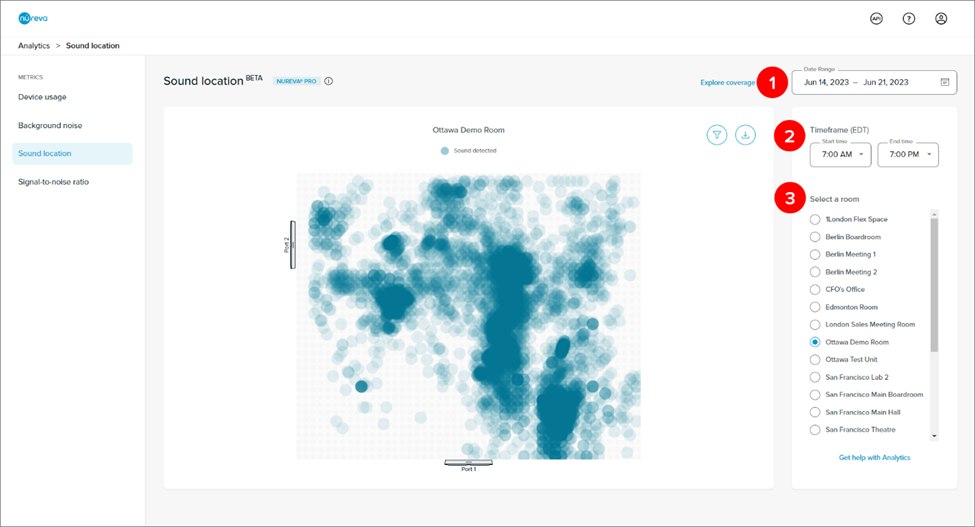
The sound location visualizer shows data about the loudest sound detected in the room during the selected period. This is measured several times per minute. The sound coming from the HDL410 speakers is not included in the data.
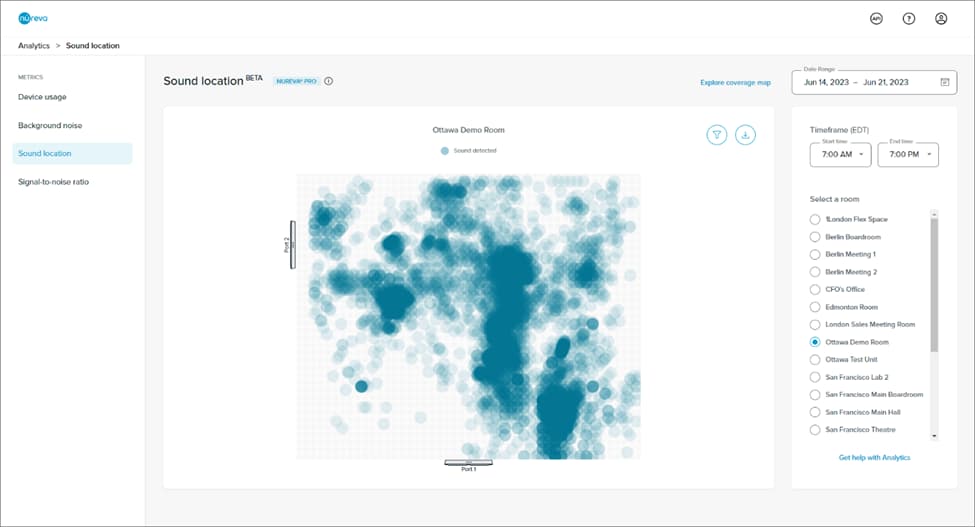
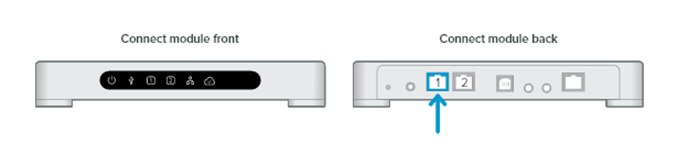
The sound location visualizer shows where the loudest sound in the room originated from during the time frame. The data points are shown relative to both of the microphone and speaker bars. Port 1 indicates the bar connected to the RJ45-1 port on the connect module. Port 2 indicates the bar connected to the RJ45-2 port on the connect module. The room dimensions are taken from the coverage map settings.
 The sound location data is processed presuming that sounds near to each other originated from the same place. When sounds are detected in the same part of the room on multiple occasions, the data points overlap and appear darker in color. Therefore, the darker the color, the higher the concentration of the loudest sounds detected in that part of the room.
By exploring sound location data in the room at different dates and times, it’s possible to determine whether there’s a pattern to the location of the sounds. Identifying patterns of use can help with understanding whether the rooms and Nureva audio devices are being used effectively.
How to explore sound location data
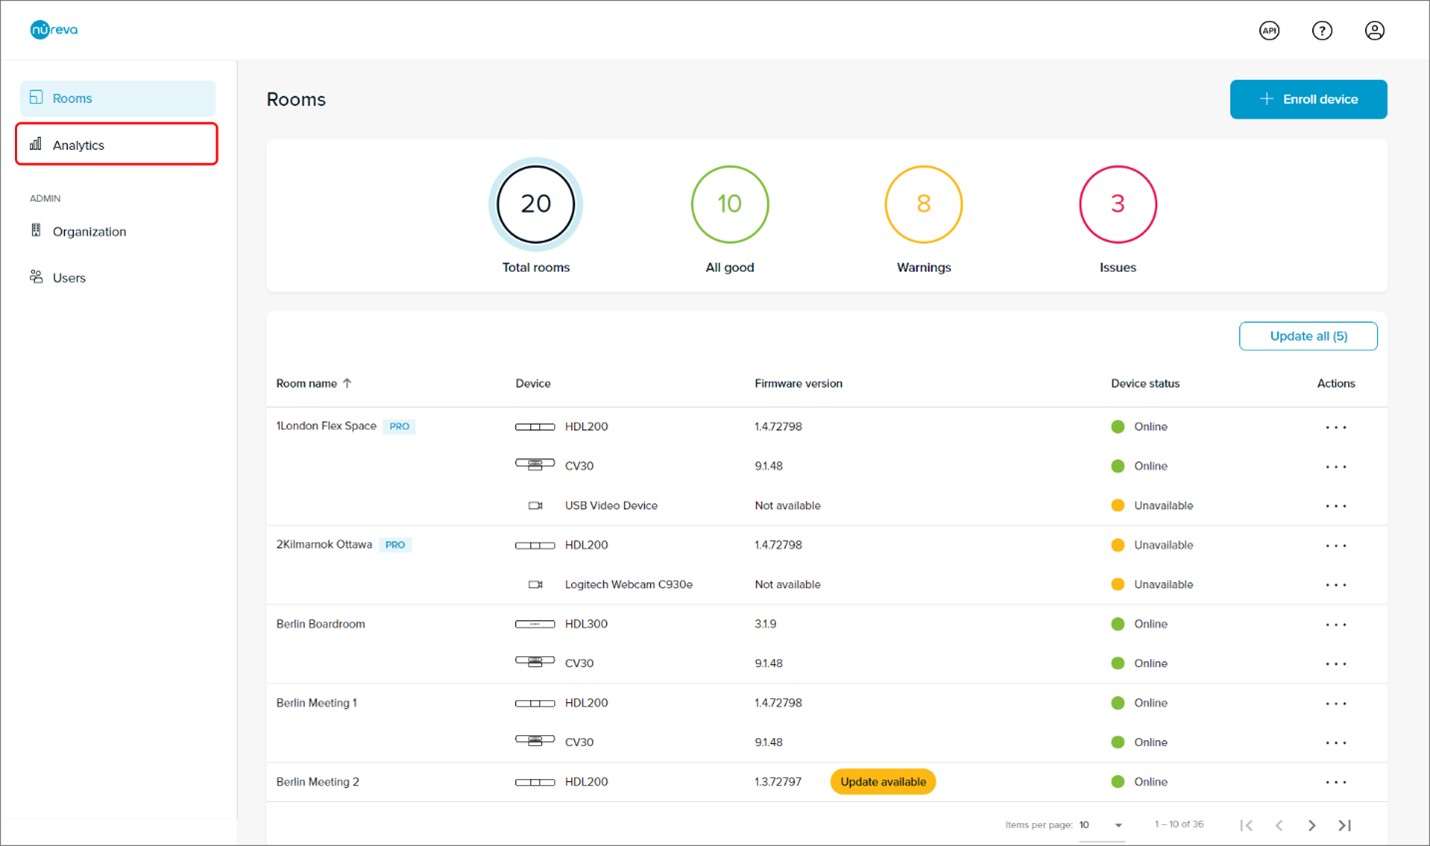
You can access the analytics feature by logging in to Nureva Console cloud and going to Analytics in the navigation menu on the left. Sound location data may not appear if sound is not generated in a room.
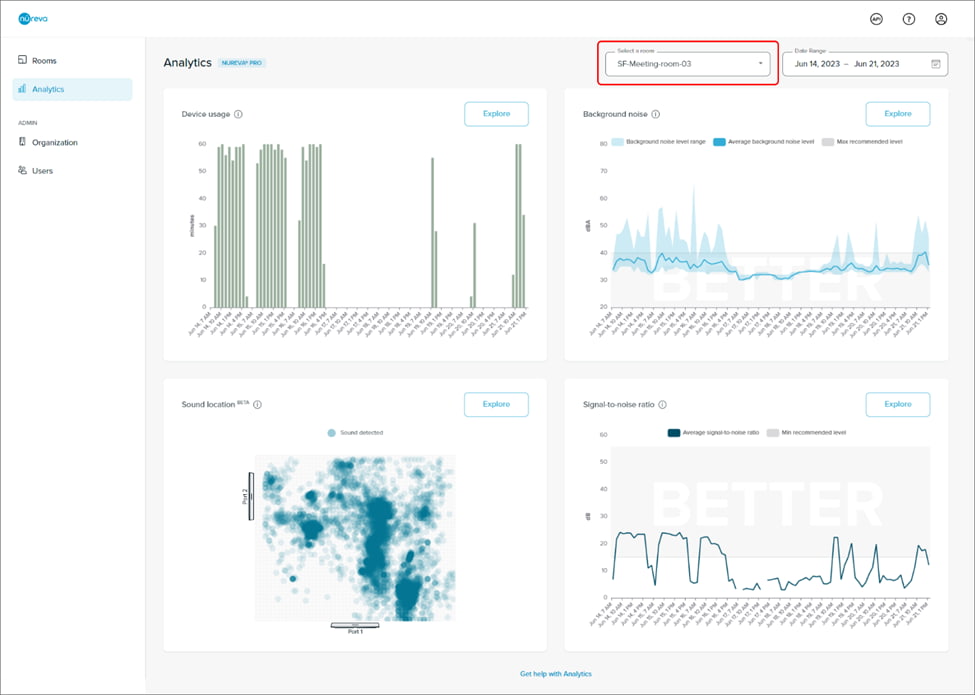
On the analytics landing page are the Device usage, Background noise, Sound location and Signal-to-noise ratio charts.
The charts show data for the first room in the organization (listed alphabetically).
View and compare data for different rooms using the Select a room list.
With a Nureva Pro plan:
Change the date range using the Date range selector at the upper right of the browser window.
By default, these charts will display data from the past week.
Select a single day or a date range of up to 31 days.
With a standard plan:
Try out this Nureva Pro feature by viewing data from the past 3 days. However, this date range cannot be changed.
On the landing page, click the Explore button for sound location data.
With a Nureva Pro plan, if a custom date range is entered, this selection will persist when exploring the chart.
See a larger version of the sound location visualizer than that on the landing page.
Customize the sound location data
Any changes made to the following options will persist when exploring the device usage, background noise and signal-to-noise ratio charts.
1. Date range
With a Nureva Pro plan:
Change the date range by clicking the calendar icon.
Select a single day or a range of up to 31 days.
The example above has a date range of June 14 to June 21, 2023.
With a standard plan:
Try out this Nureva Pro feature by viewing data from the past 3 days (the date range cannot be changed).
2. Time frame
This setting filters the data from the selected date range to show certain time periods of each day.
The example above shows a time frame of 7:00 a.m. to 7:00 p.m. Data captured on the selected days between 7:00 a.m. and 7:00 p.m. is displayed.
Change the time frame using the drop-down menus for Start time and End time.
The minimum range is 1 hour.
The time zone will match the computer being used to access the analytics. This might not be the same as the time zone in which the Nureva audio device is located.
Selecting a longer timeframe will display a broader visualization.
Data points that do not contribute to a larger pattern of use are removed to make it easier to spot such patterns.
To see more detailed sound location data, try selecting a shorter time frame.
3. Select a room
View and compare data for different rooms by selecting rooms in the list.
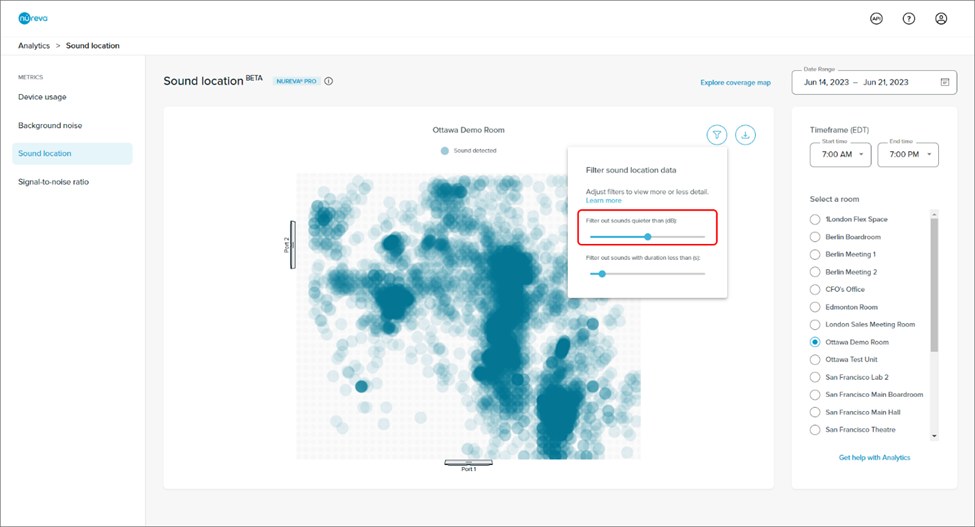
Filtering sound location data
The sound location visualizer provides filtering controls to help identify patterns in the data. Filtering options allow for the reduction of “noise” in the data to make trends more obvious. Any changes made to the filters will not persist when moving away from the page. Sound location data can be filtered in two ways:
1. Filter by sound level
For example, filter out all sounds below a specified decibel (dB) level.
Sounds below 45 dB are not included in the data.
2. Filter by sound duration
For example, filter out sounds lasting less than a specified time duration.
Sounds that last less than 0.5 seconds are not included in the data.
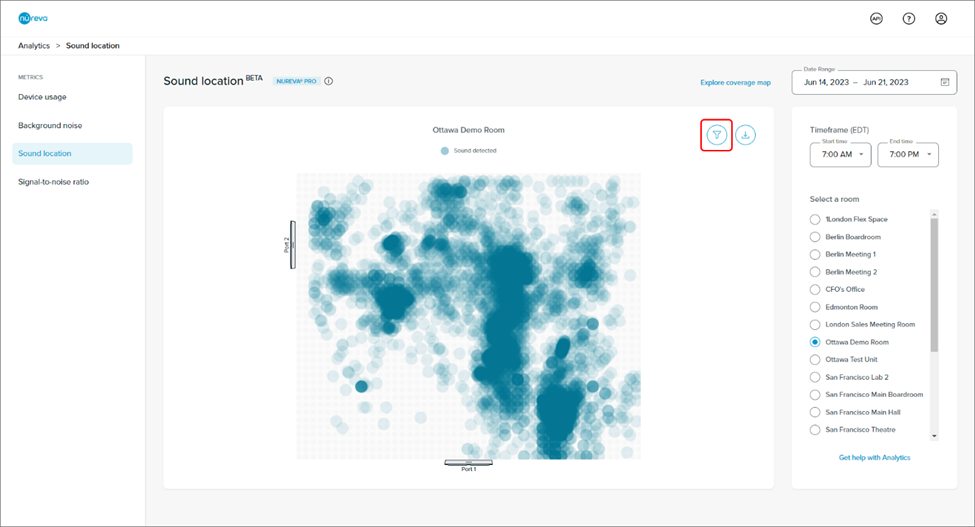
Using the filtering tools
Click the filtering icon at the upper right of the sound location visualizer.
Adjust the sound level slider (top slider) to filter by sound level. The range is 45 dB to 75 dB.
Adjust the sound duration slider (bottom slider) to filter by sound duration. The range is 0.5 to 15 seconds.
Exporting sound location data
Sound location data can be exported as a CSV file.
Click the export icon next to the filter icon, at the upper right of the sound location visualizer.
The data currently visible in the chart will be downloaded through the browser.
The CSV file will reflect the date range and time filter selected at the time of export and the current sound level and sound duration filter selections.
The export button will not be available if there is no data visible in the chart.
Troubleshooting
Sound location data is available only for rooms with HDL410 devices. To view this data, the HDL410 device must be fully connected. If one or both microphone and speaker bars are disconnected from the connect module, the sound location data chart will not be available. A message will appear saying: Sound location data is only available for rooms with HDL410 devices.
Also, sound location data is generated only when both microphone and speaker bars are connected to the connect module. If one or both microphone and speaker bars were disconnected from the connect module, there would be a data gap in the sound location data chart.
Learn more
Learn more about how to explore and interpret other data types:
Get a general overview of analytics features, including troubleshooting information:
Get started with Nureva Console analytics
Discover the extra features and protection available with Nureva Pro: